Use Overview Dashboard for “at a glance” status reports for tool software version and tool communication.
Overview Dashboard can be accessed directly by clicking on dashboard on the home screen. This dashboard is accessible if the user has access to and selects multiple locations in the location filter. If the user selects a single location, the website displays the dealer dashboard
Corporate Dashboard
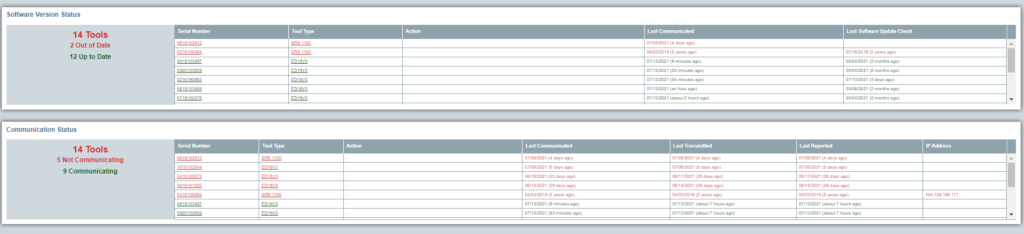
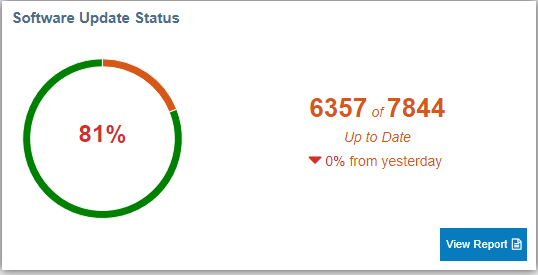
Software Update Status
This chart shows the number of tools using up-to-date internal software. Click on View Report button to display the detailed list of tools in the software version status report
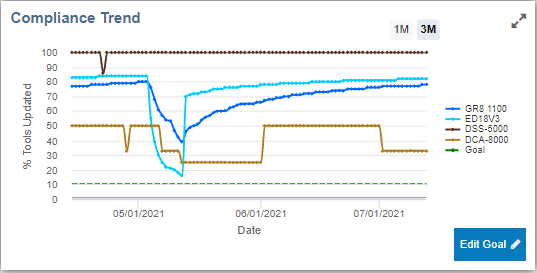
Compliance Trend
This chart displays the percentage of tools using up-to-date internal software. Click Edit Goal to adjust the % Tools Updated Goal parameter indicated by the dashed horizontal green line.
Click 1M or 3M to select between one month of 3 months of trend
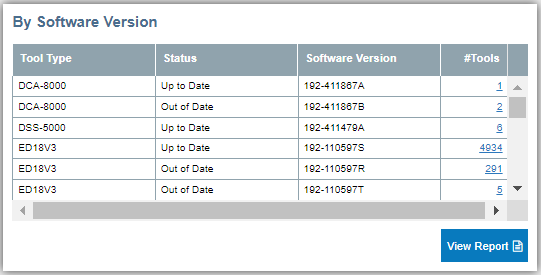
By Software Version
This chart displays a list of tools including internal software status, current version, and the number of tools in that category. Click “View Report” to display the underlying detailed “Software Version Status” data.
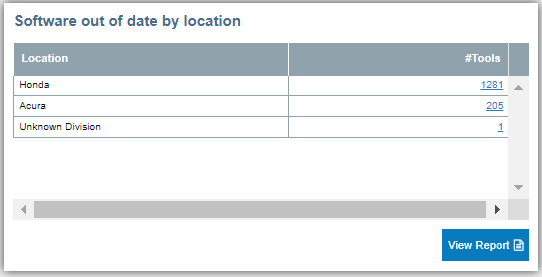
Software out of date by location
This table displays the list of tools using out of date software by location. Click “View Report” to display the underlying detailed “Software Version Status” data
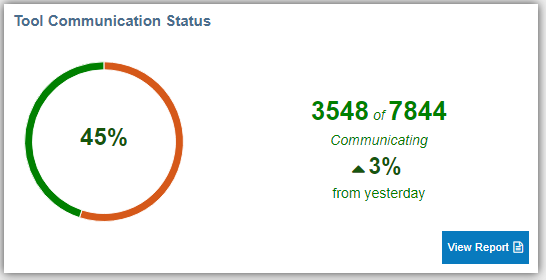
Communication Status
This chart displays the percentage of tools communicating and transmitting test data. It includes the total number of available tools and the net daily change. Click “View Report” to display the underlying detailed “Equipment Tracking” Data
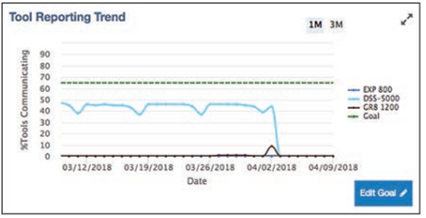
Tool Reporting Trend
This chart displays the percentage of reporting tools by tool type against the user-entered goal. Click Edit Goal to adjust the reporting goal, indicated by a dashed horizontal line
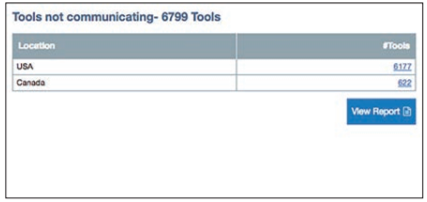
Tools not communicating
This table lists the number of tools not communicating by locations. Click on tool count to drill deeper in to the location hierarchy. Click “View Report” to display the underlying detailed “Equipment Tracking” data
Dealer Dashboard
Dealer dashboard is displayed when user selects or has access to only one location. This dashboard gives a quick overview of all the tools at that location, their software version status and their communication status.