Data used in BMIS can usually be displayed in a table view or on a map view
Map View
Map View is used for displaying communication or software update status of the the tools based on their location data.
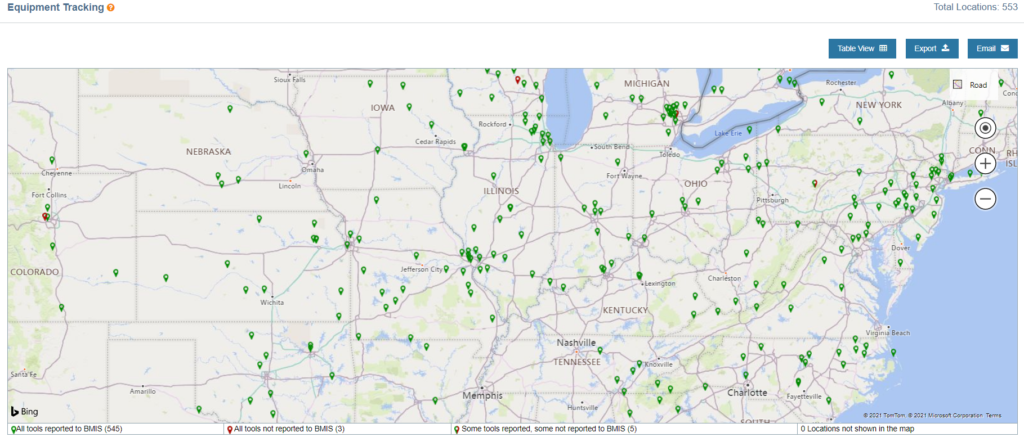
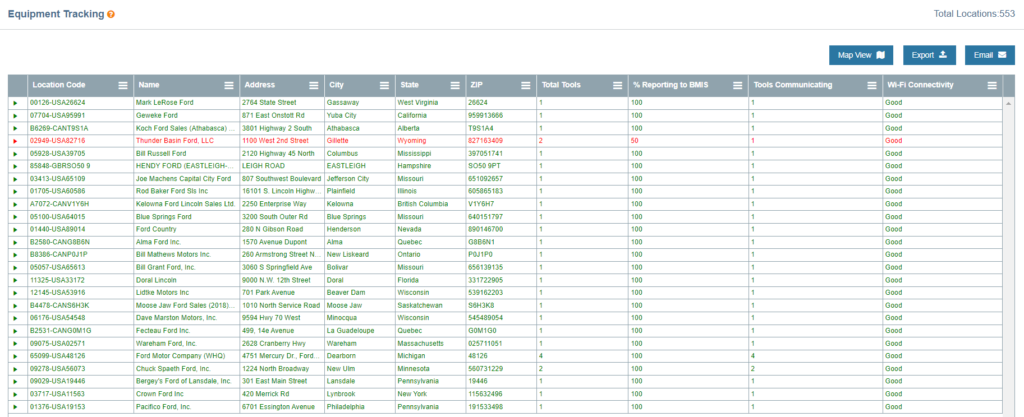
Table View
Data in a Table View report is displayed in a series of columns and rows. Columns in Table View reports are sortable by clicking on the column header.
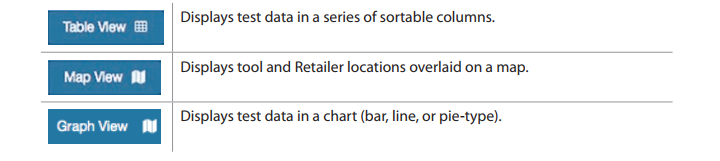
Changing Views
Following three buttons on the top right of the reports are used to toggle between different views
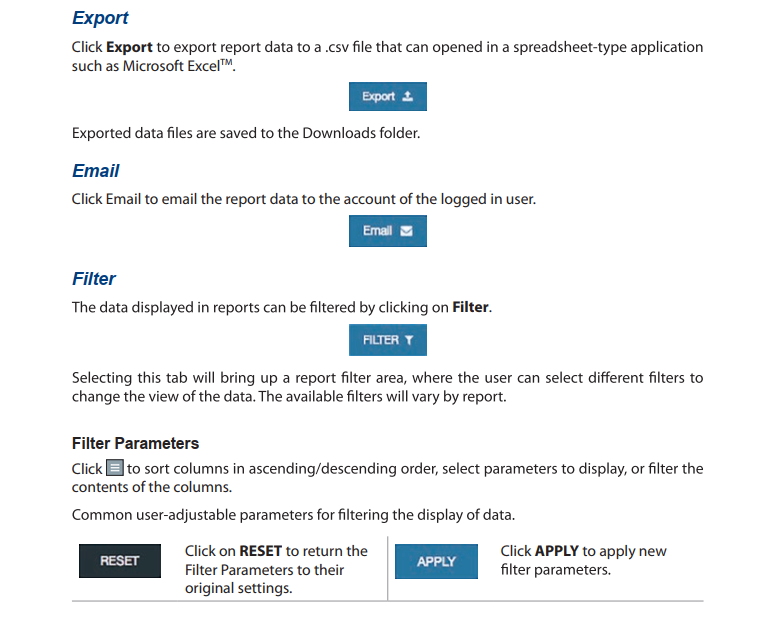
User can also export, email or filter the report using the following buttons